
From acquired data to dependable decisions.
SIAGIS provides specialist processing, interpretation, reporting and digital delivery for hydrographic and geophysical projects. A professional team leads the workflow from source-data review to quality-controlled outputs, with methods and deliverables agreed for each project.
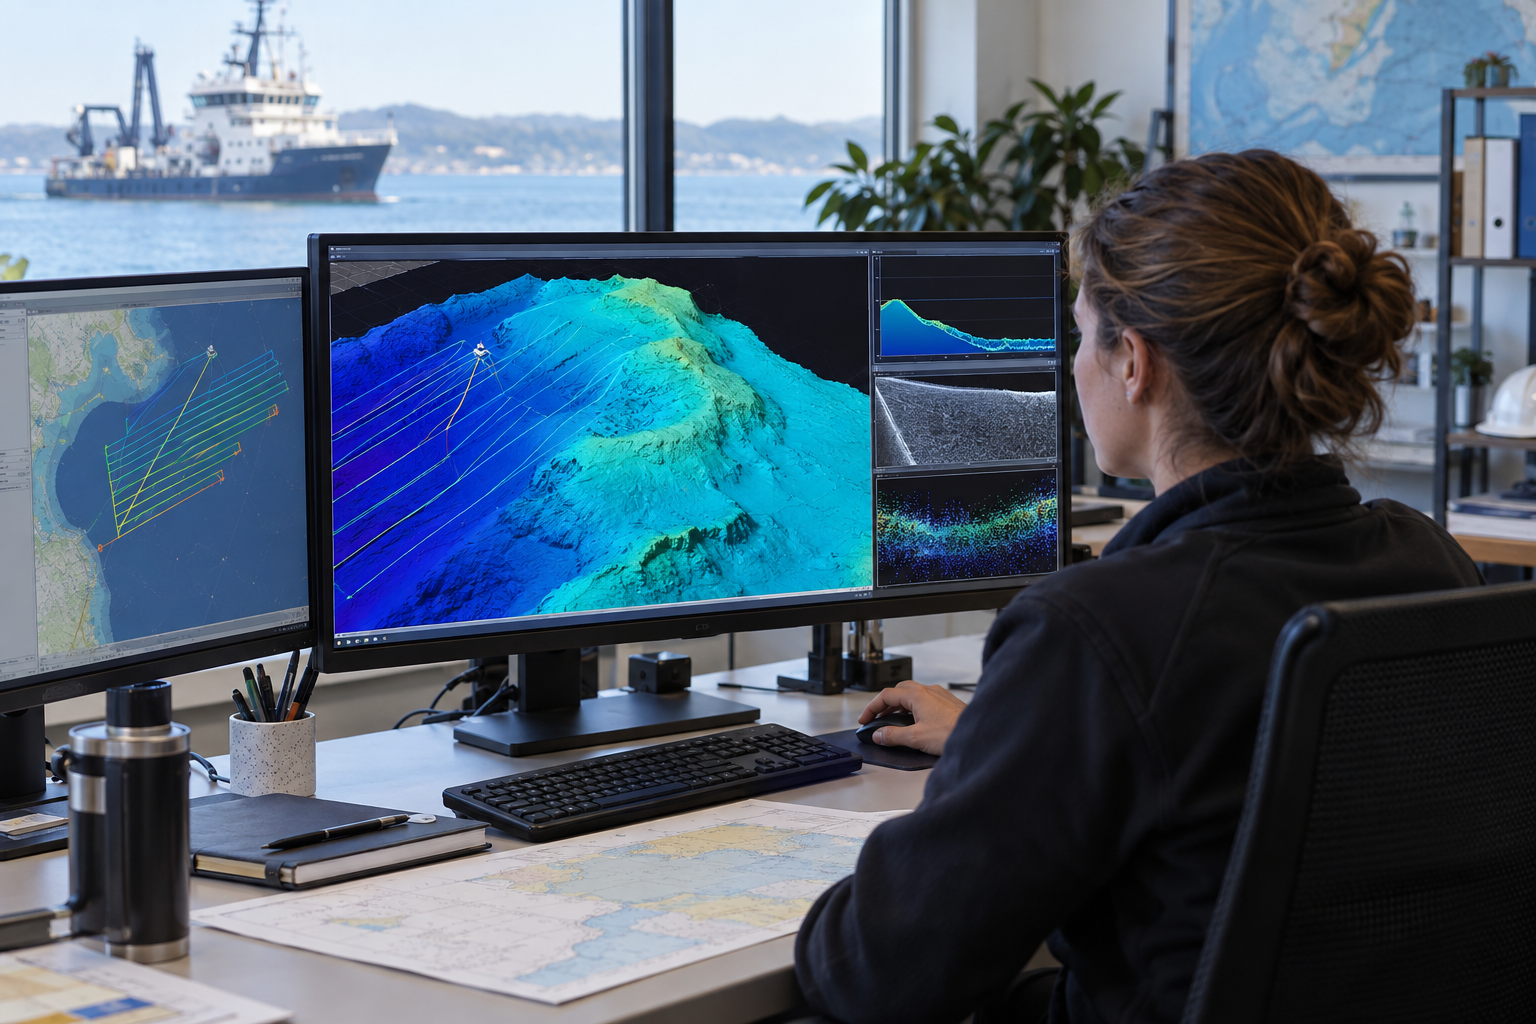
Bathymetry Data Processing
We bring single-beam and multibeam soundings into a consistent position and vertical reference, apply appropriate corrections, clean the measurements and assess coverage and uncertainty. The validated depths are turned into surfaces suited to the agreed survey purpose.
Processing focus
- Position, motion, sound speed and tide review
- Sounding cleaning and cross-checks
- Coverage, uncertainty and surface QC
Quality-controlled soundings, bathymetric grids, contours, profiles and processing records.
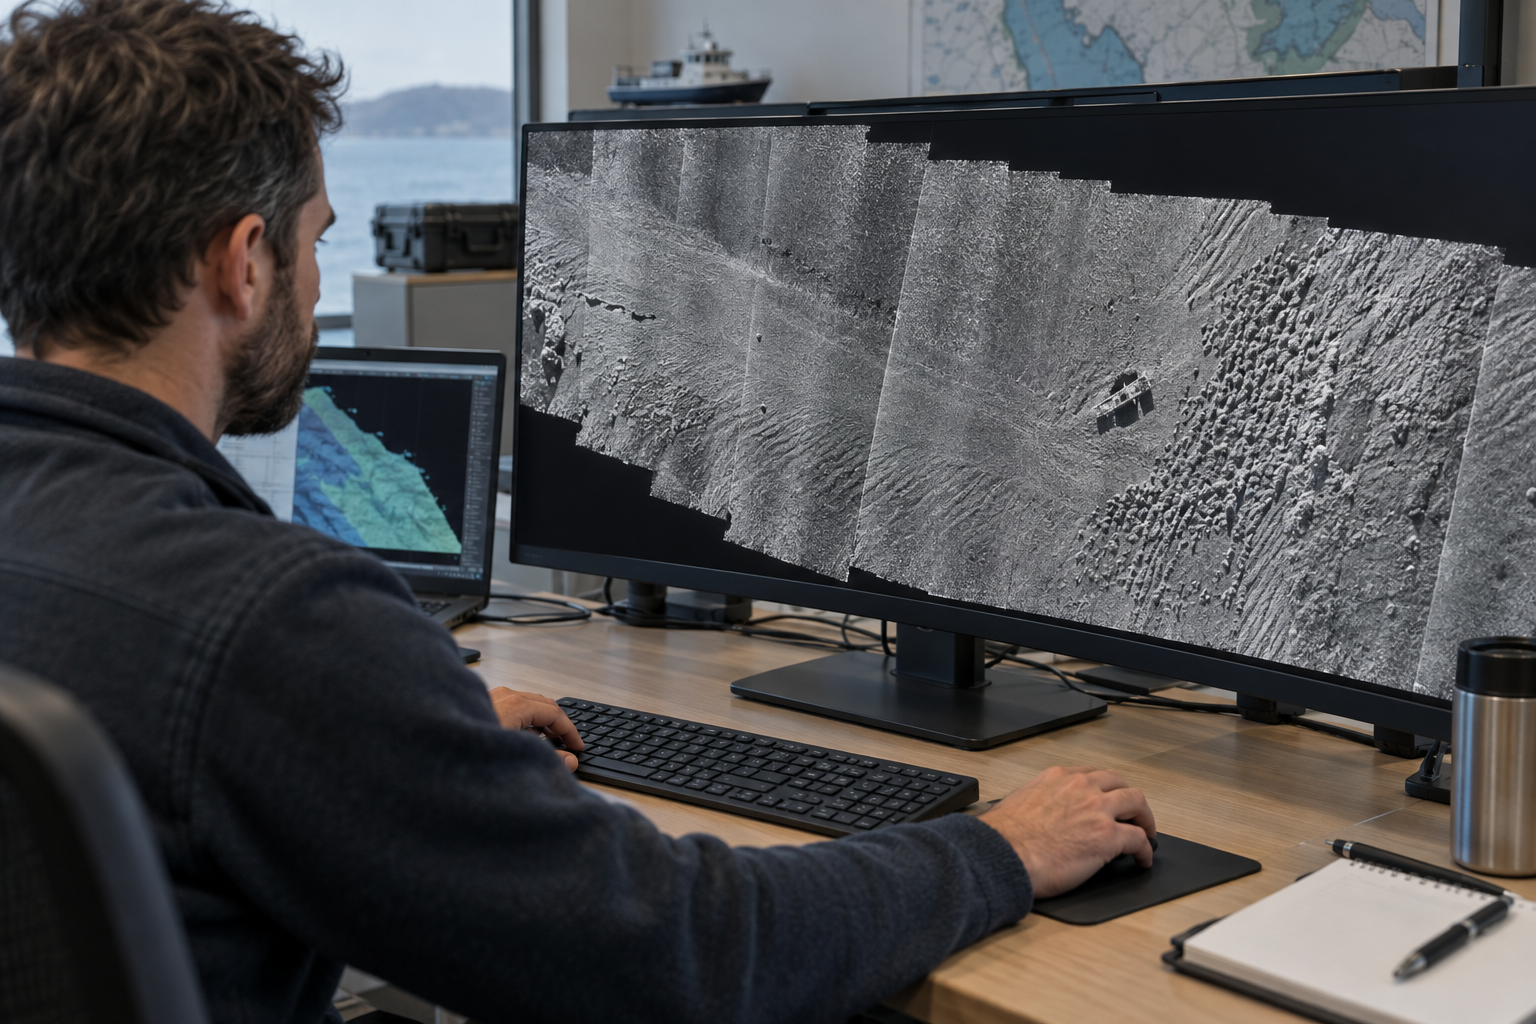
Side-Scan Sonar Mosaic Processing
Side-scan sonar lines are positioned, corrected, reviewed for image quality and combined into a georeferenced seabed mosaic. Visible features and possible targets can be interpreted with supporting bathymetry and survey records.
Processing focus
- Line positioning and image correction
- Seamless mosaic and coverage review
- Feature and target interpretation
Georeferenced sonar mosaic, feature or target register and interpretation maps.
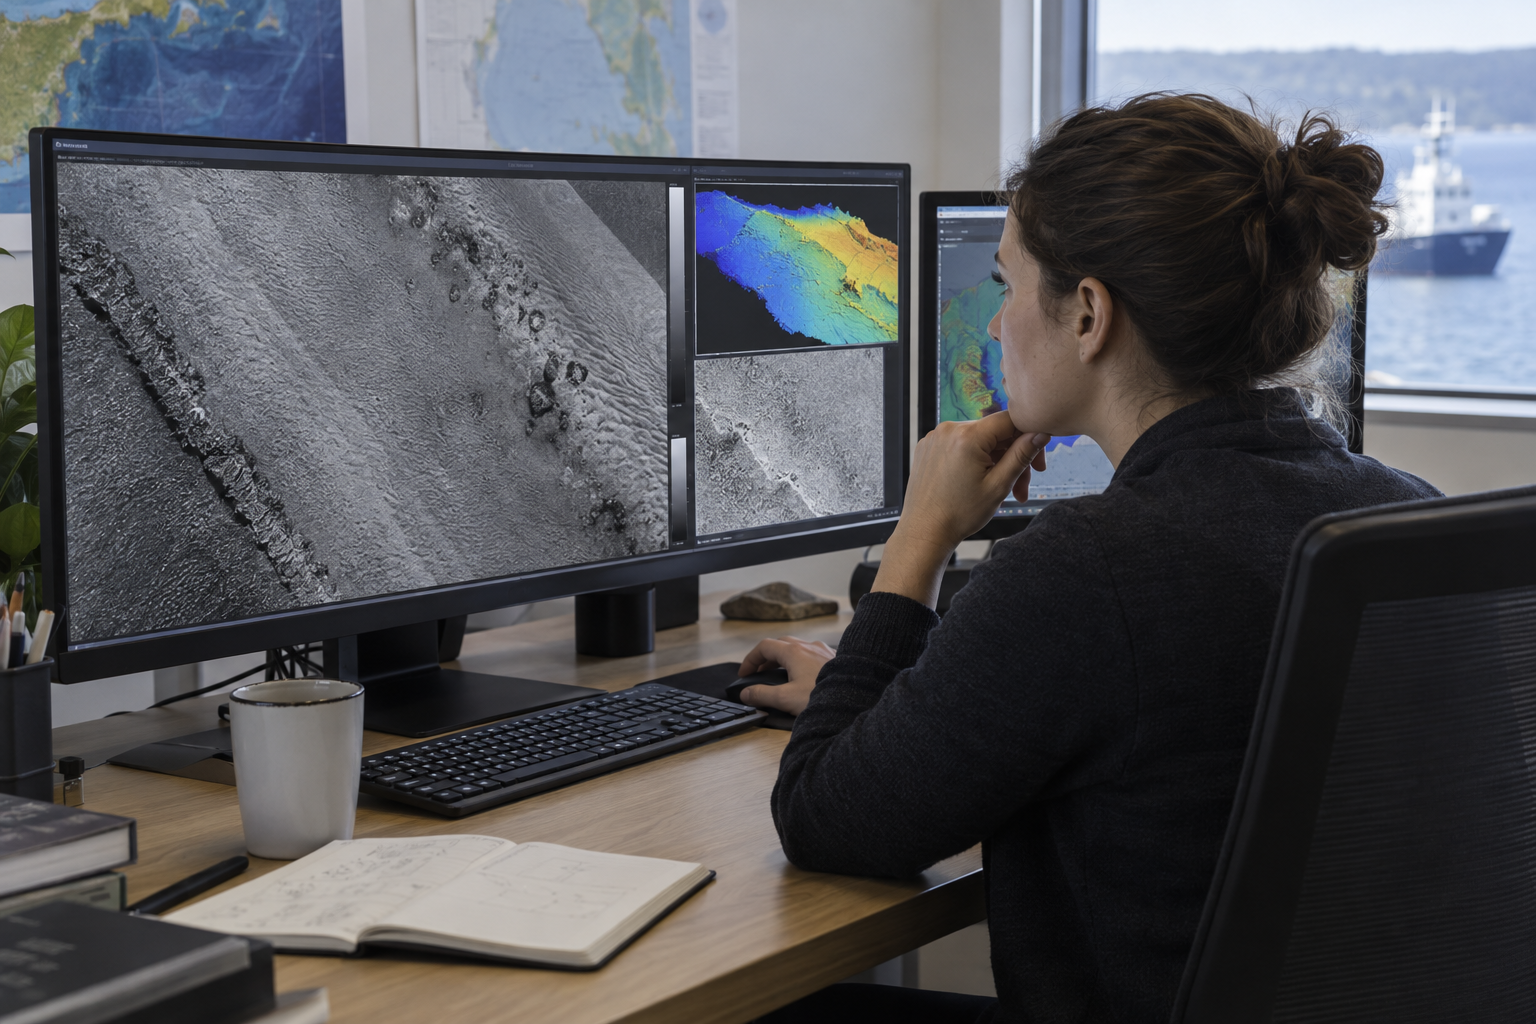
Backscatter Data Processing
Multibeam backscatter intensity is checked and normalised for acquisition effects before being assembled into a spatial image. Patterns can help distinguish changes in seabed character, with interpretation tied to calibration and ground-truth data where available.
Processing focus
- Intensity and acquisition review
- Mosaic consistency
- Seabed-texture interpretation
Backscatter mosaics, processing notes and interpreted acoustic zones.
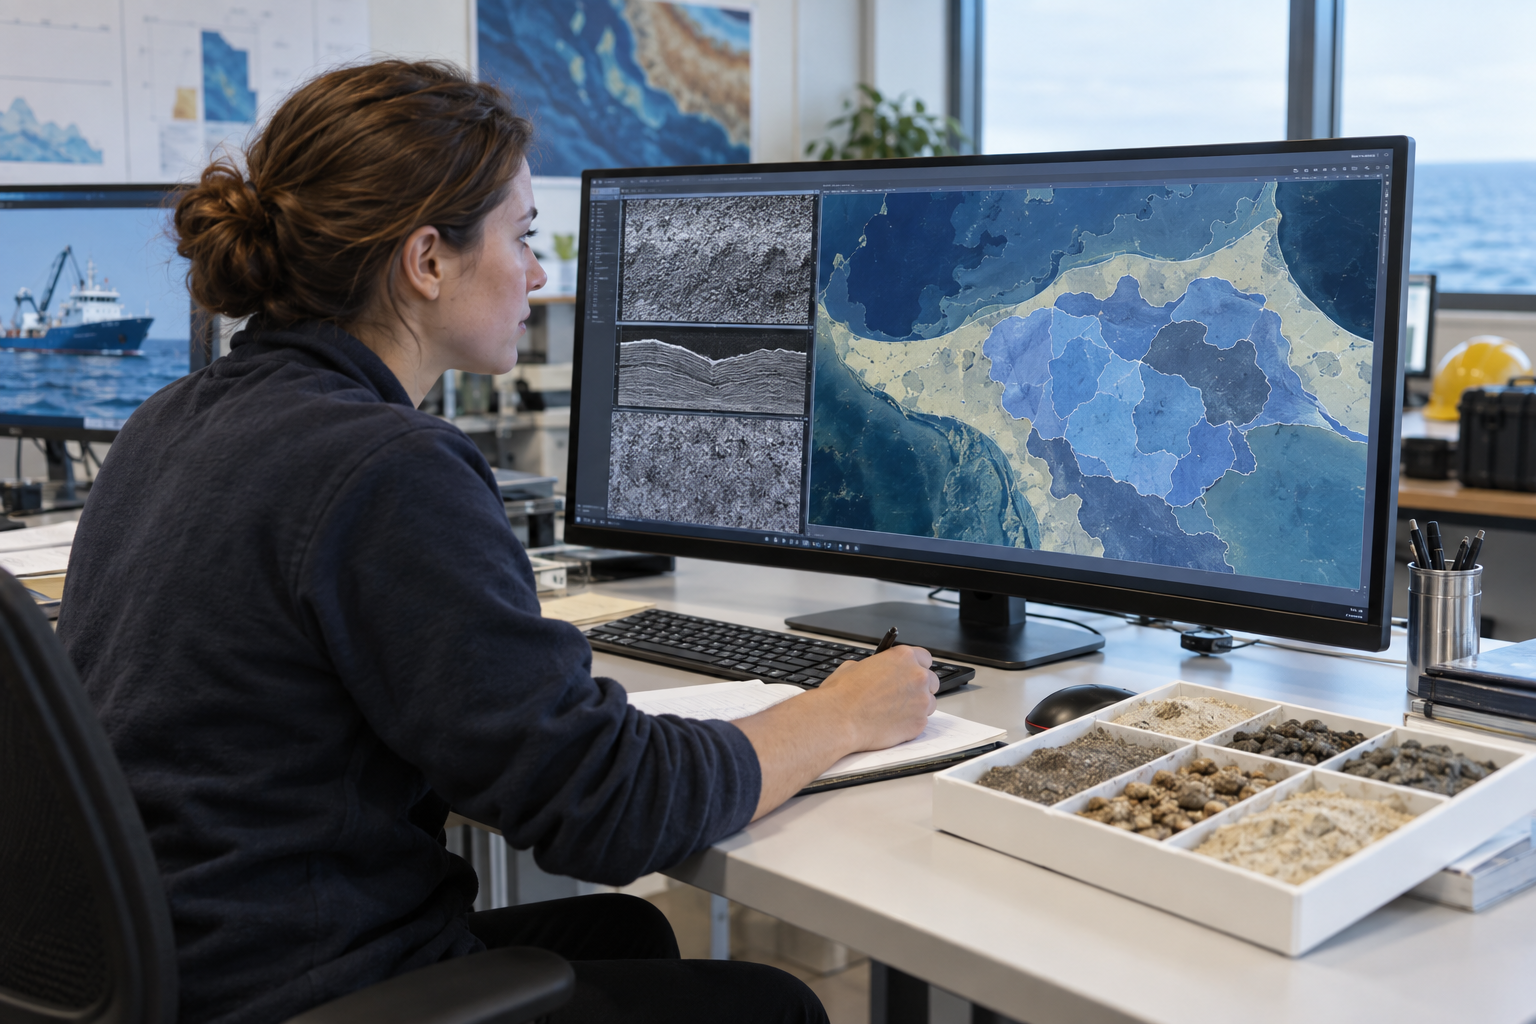
Seabed Classification Processing
Bathymetry, acoustic imagery and available samples are compared to map seabed units and features. Classification boundaries and confidence are documented so users can distinguish observations from interpreted sediment or habitat classes.
Processing focus
- Acoustic and terrain patterns
- Sample correlation
- Class boundaries and confidence
Seabed classification map, GIS polygons, evidence register and interpretation report.
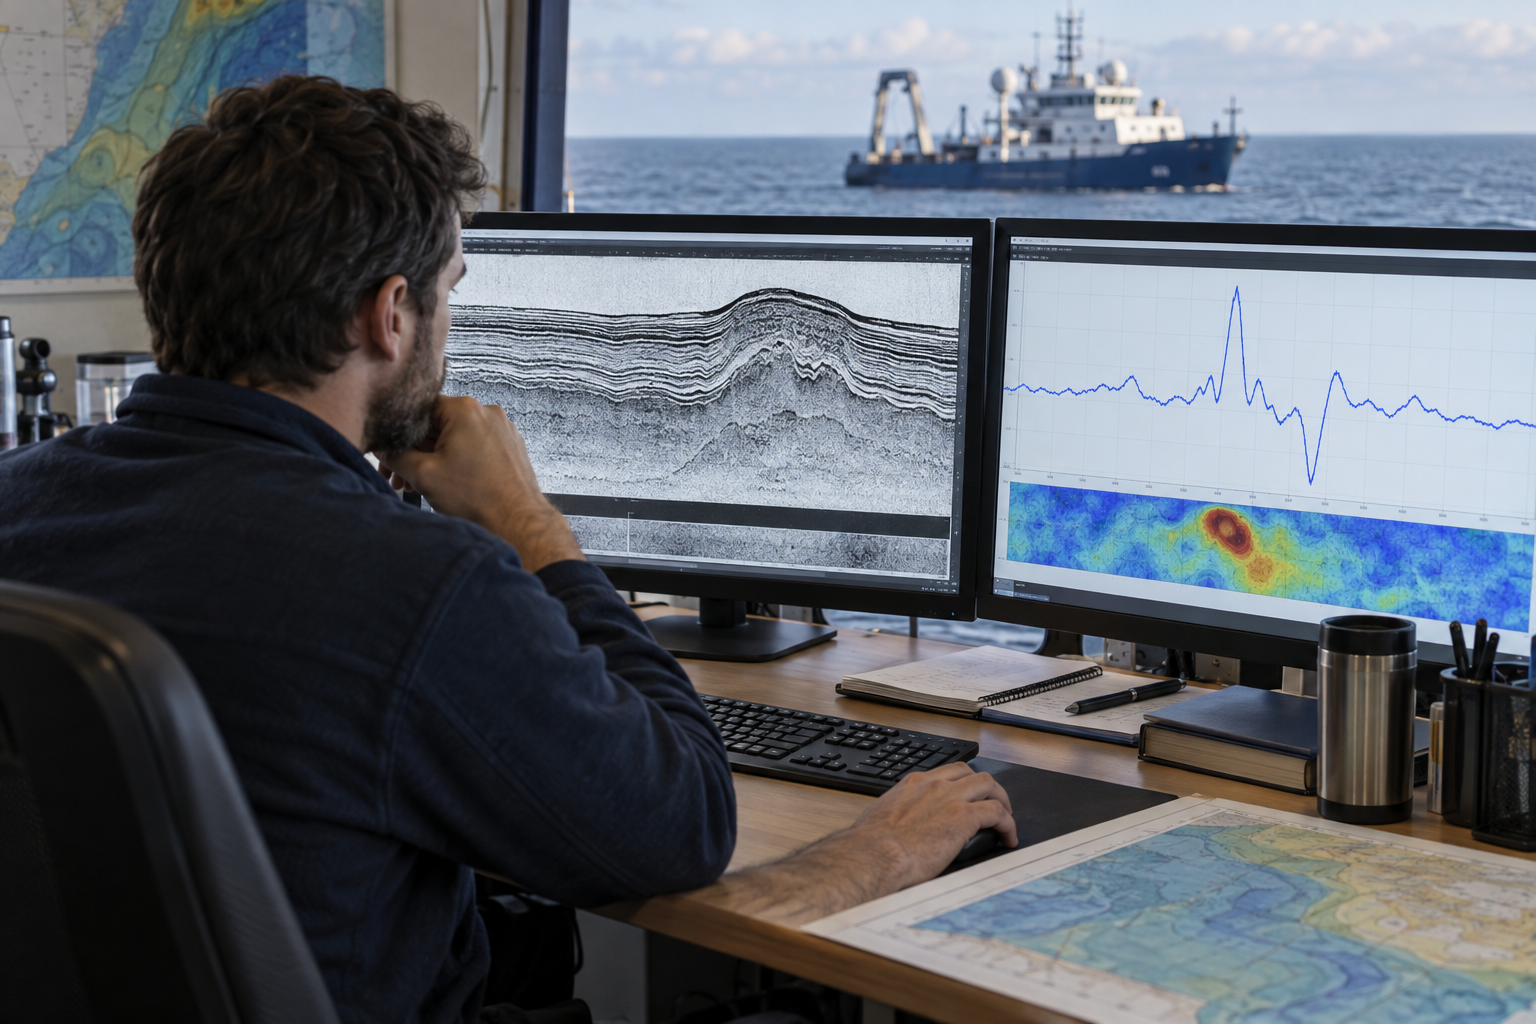
Sub-Bottom & Magnetometer Processing
Sub-bottom profiles are corrected and interpreted to identify shallow acoustic reflectors and buried features. Magnetometer readings are adjusted and reviewed for anomalies; the two datasets remain distinct but can be compared with other survey evidence.
Processing focus
- Profile correction and interpretation
- Magnetic anomaly review
- Cross-dataset correlation
Interpreted sub-bottom sections, anomaly maps and target or feature schedules.
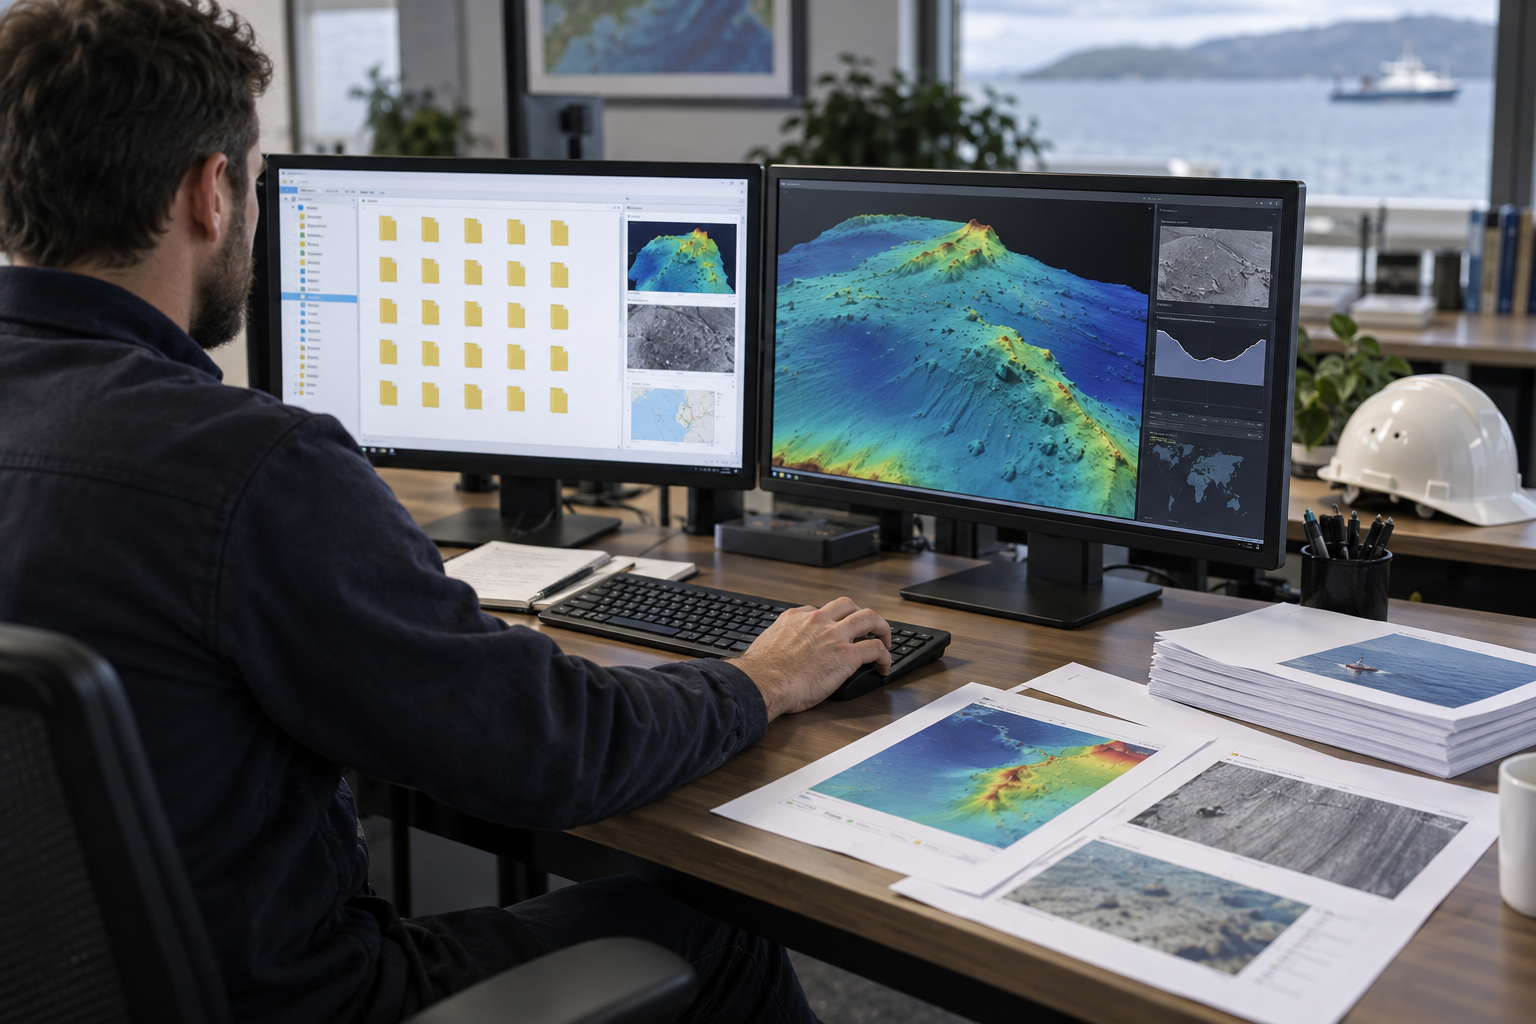
Digital Data Deliverables
Processed survey data is packaged in agreed, usable formats with clear naming, coordinate reference, metadata and quality-control records. Source, intermediate and final versions can be organised so each deliverable remains traceable.
Processing focus
- Format and folder specification
- Metadata and version control
- Completeness and acceptance checks
Structured data package, metadata, QC logs, processing report and client-ready files.
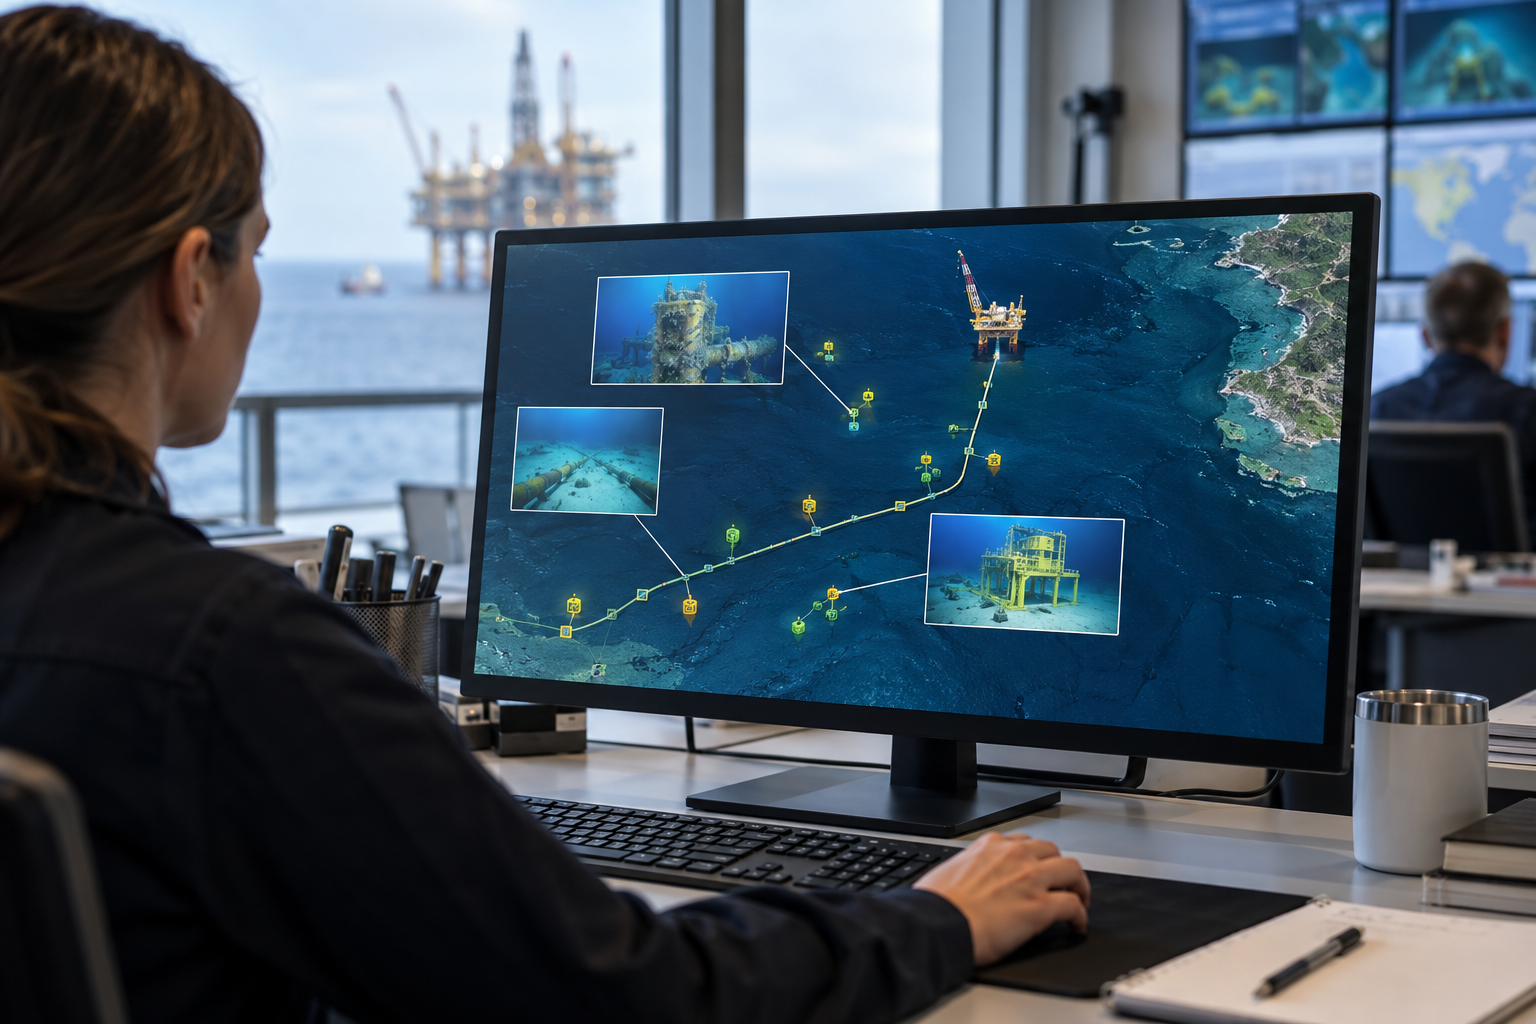
Subsea Assets Database Management
Surveyed asset positions, identifiers, inspection records and supporting imagery are brought into a controlled spatial register. The database helps teams find the latest verified record for pipelines, cables, structures and other subsea infrastructure.
Processing focus
- Asset IDs and geospatial locations
- Inspection and survey history
- Data validation and updates
Searchable asset register, GIS layers, linked evidence and update history.
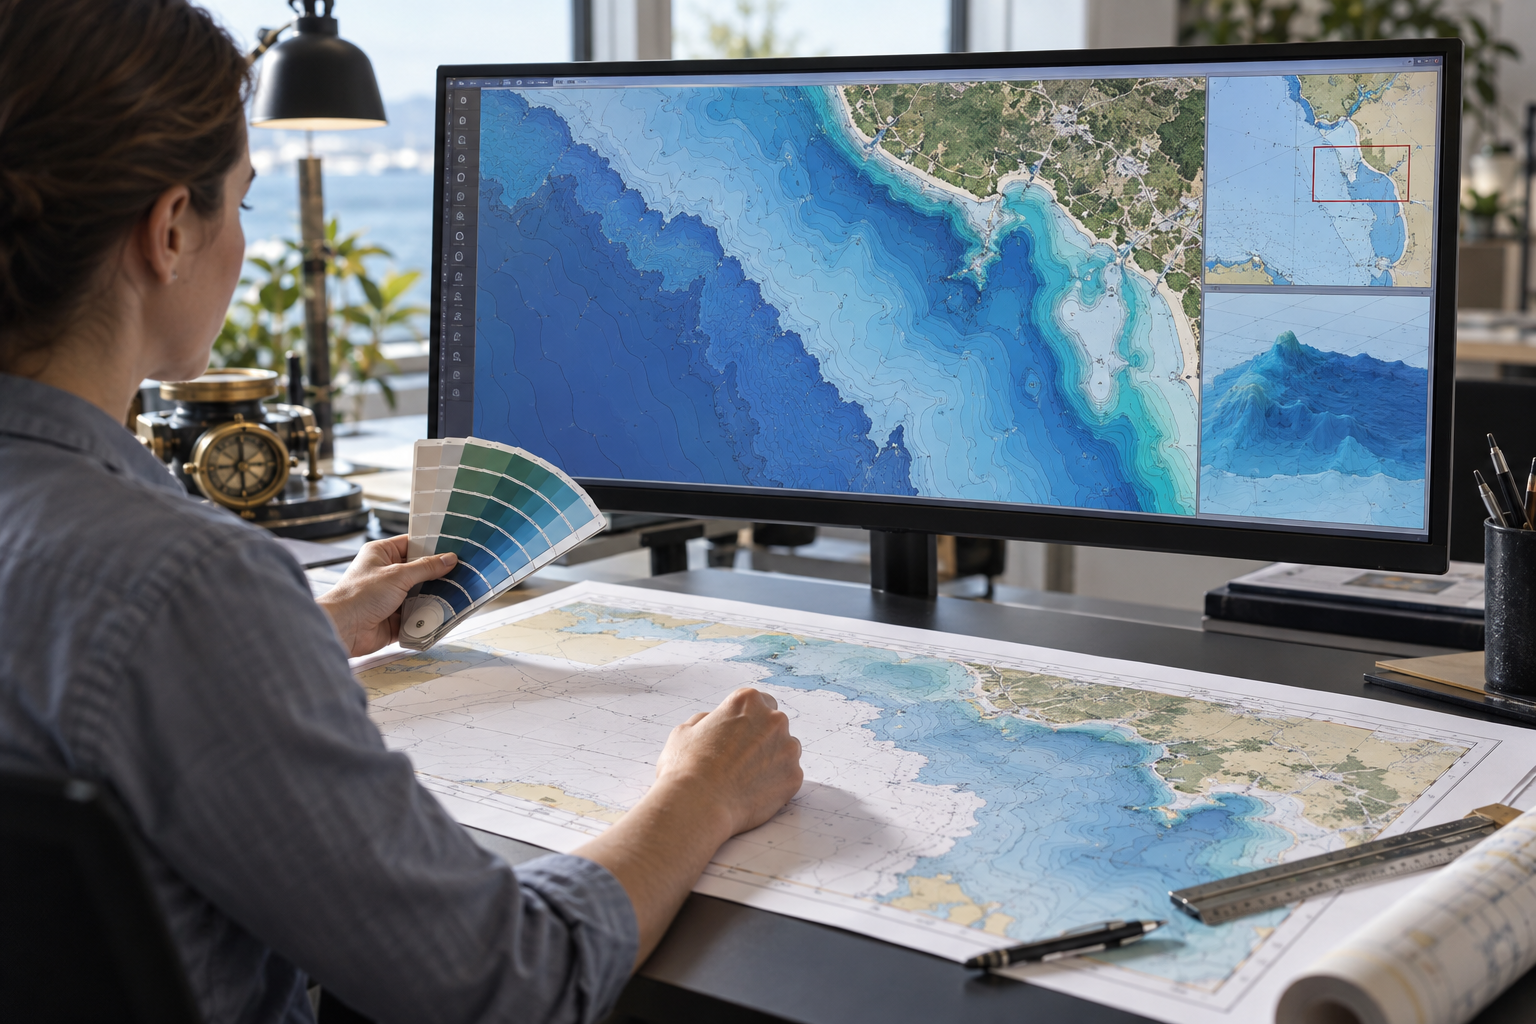
GIS Maps & Charts Production
We turn validated survey layers into readable project maps, figures and charts with appropriate scales, legends, references and revision control. Products are designed for the intended audience, from technical review to operational planning.
Processing focus
- Bathymetric and feature mapping
- Consistent symbology and datums
- Print and digital layouts
GIS layers, map series, survey charts, report figures and export files.
Images are AI-generated illustrations of processing workflows, not photographs of SIAGIS projects or software.
Standards-led, traceable processing
Our team defines the processing plan, checks source data and calibration, controls coordinate and vertical references, documents corrections and reviews the final products before handover. Work is aligned with applicable industry standards, including IHO S-44 for relevant hydrographic surveys, and the agreed client specification. Interoperable formats and complete metadata support future use, audit and integration.
Discuss Data Processing with SIAGIS
Share the data types, survey scope, required standards and deliverable formats.